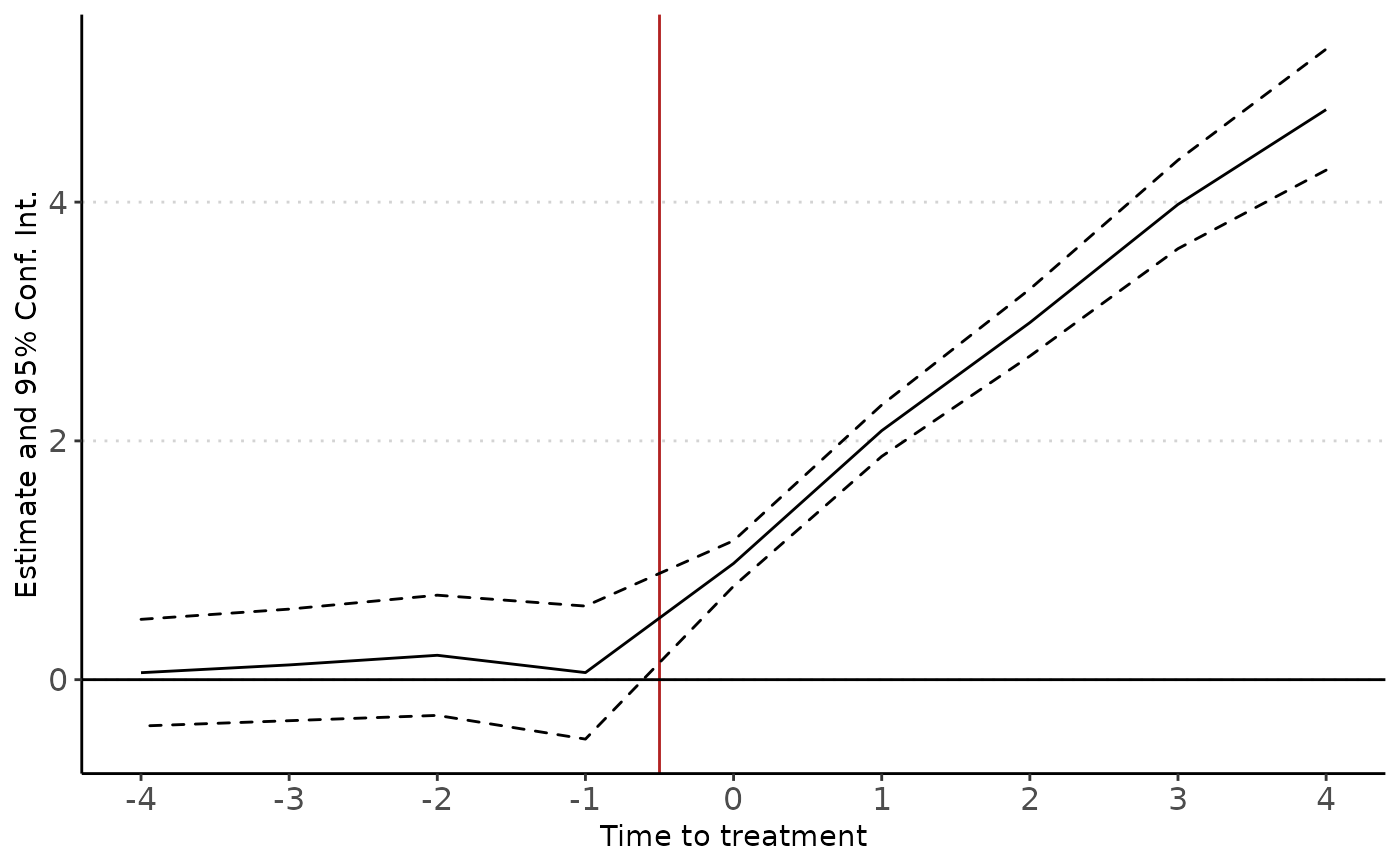
Takes a didImputation estimation and return a graph of estimated parameters(for dynamic effects only).
didplot(object, type = "default", ci = 0.95, ...)
Arguments
| object | an object of class DidImputation. |
|---|---|
| type | Character. Type of plot. Can be either 'default' or 'IR' for impulse response style. |
| ci | Numeric. Confidence interval( 0.95 by default). |
| ... | additional arguments. |
Value
A ggplot2 object
Examples
# standard plot res <- didImputation(y ~ 0 | i + t, cohort = 'g', data = did_simulated) didplot(res)# Plot with 99% confidence interval didplot(res, ci = 0.99)
# Plot with Impulse response function style didplot(res, type = 'IR')